
Get a basic understanding on how to read and interpret a statement of profit or loss
The objective of a SPL, also commonly known as “Income Statement”, is to provide a summary of a company’s financial performance over a set period of time. This statement allows to understand the ability of a company to generate sales, manage its costs and generate profit.
Financial statements are ordinarily prepared on a “Going concern” basis, meaning that the company will continue to operate within a foreseeable future.
The International Accounting Standard 1 (IAS 1) sets out the framework and overall requirements for the correct presentation of financial statements with the objective “to provide information about the financial performance of an entity that is useful to a wide range of users in making economic decisions” (IAS 1 – Presentation of financial statements, 2007).
Additional accounting standards come into play when recognizing revenues or expenses to ensure that the accounts are “true and fair” and comparable between companies.
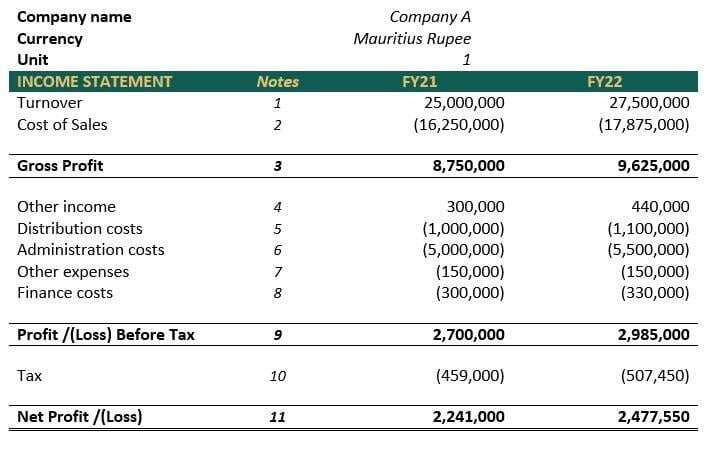
The SPL shown above is based on the Mauritius Corporate and Business Registration Department template filed and available online (https://onlinesearch.mns.mu/). It is a “Nature of expense” type of statement, showing the nature of expenses as a group rather that detailed one by one.
1. Turnover
The top line of the SPL is the “turnover” or revenue line. This line summarizes the total sales generated by company within a financial year.
e.g. Company A generated Rs 25.0M in sales in FY21 and Rs 27.5M in FY22. The business generated additional sales of Rs 2.5M between FY20 and FY21, representing a 10% growth year-on-year.
2. Cost of sales
Below the turnover line is the cost of sales (“COS”) or “cost of goods sold” line. This shows the cost incurred to purchase or manufacture a product which is then sold by the company, as normal course of business, to customers.
e.g. Company A's COS was Rs 16.3M and Rs 17.9M in FY21 and FY22 respectively. In other words, the company incurred a cost of Rs 16.3M to generate sales of Rs 25.0M in FY21 and Rs 17.9M to generate sales of Rs 27.5M the following year.
3. Gross Profit
The Gross profit (“GP”) line represent the earning generated by the company after deducting the COS from total amount of sales [GP = Turnover – COS].
e.g. Company A gross income in FY21 was Rs 8.8M, being the business revenue of Rs 25.0M minus COS of Rs 16.3M. The company’s GP margin was 35.0% for both financial years.
4. Other Income
The other income line goes below the GP line as it is income derived from activities unrelated to the main business activity. Common examples of other income are rent revenues or sale of fixed assets.
e.g. Assuming that Company A is a manufacturer of a specific product and other income were generated from renting part of their office, these rent revenues are not generated by their core business activity. Therefore, Rs 400K in FY21 and Rs 440K in FY22 have been accounted for as other income and not as revenue (top line).
5. Distribution costs
This first line of costs in the SPL above, also known as “distribution expenses”, represent the costs incurred to deliver your product from the manufacturer to the end-client. In other words, the expenses relating to the transport of products. Any of transport costs, logistics expenses, warehousing expenses and repairs of vehicles used for this purpose fit under this category of expenses.
e.g. Company A incurred costs of Rs 1.0M in FY21 and Rs 1.1M in FY22. In FY21, distribution costs represented 4.0% of revenues.
6. Administration costs
Administrative expenses are costs relating to the functioning of a business, but not directly related to the manufacture of the products sold by the company. These are necessary to the operation of the company, such as salaries, offices rental, systems, insurances, electricity, stationaries etc.
e.g. Administration costs in FY21 and FY22 were Rs 5.0M and 5.5M respectively. Company A, therefore, needed to disburse these amounts previously mentioned to run the business.
7. Other expenses
This line item represents the additional expenses that do not fit into the above-mentioned categories but need to be treated as an item in the SPL.
A common example is depreciation. This item is not a cash outflow as such but impacts the financial performance of a company and needs to be expensed within the SPL.
e.g. Company A’s other expenses for both financial years were Rs 150K. This assumes a depreciation of fixed assets using a straight-line basis method.
8. Finance costs
Also known as “interest expenses”, finance costs are defined as costs incurred in relation to the borrowing of funds, such as interest paid on long term borrowings, short term borrowings or leases.
e.g. Company A’s cost of financing / borrowing in FY21 was Rs 300K and Rs 330K the following year.
9. Profit /(Loss) Before Tax
The profit before tax (“PBT”) line is a measure of a company’s profits after deducting all operational expenses. Taxes due by the company for the financial year will be calculated on this figure.
e.g. In FY21, Company A’s profit after deducting all expenses but before corporate tax was Rs 2.7M, representing a 10.8% PBT margin.
10. Tax
The tax line within the SPL represents the corporate tax payable (15% + 2% CSR in Mauritius) for a financial year, calculated on the PBT line above. Tax payable for a year may not equate to 17% of PBT due to accumulated tax losses or other circumstances.
e.g. Tax payable by Company A in FY21 and FY22, was Rs 459K and 507K respectively. These figures were obtained as follows: -PBT x 17%.
11. Net Profit /(Loss)
The bottom line of the SPL shows the net earnings, or Profit after tax (“PAT”), of the business after deducting all operational and statutory expenses. This is the profit available for shareholders. If the company satisfies the necessary criteria outlined within the companies act such as satisfying the solvency test, dividends can be paid from this profit available.
e.g. Net earnings generated by Company A for FY21 was Rs 2.2M, representing a PAT margin of 9.0%. PAT increased by Rs 237K to reach Rs 2.5M in FY22, also representing a 9.0% margin.
However, these financial summaries are not detailed and crucial data cannot be drawn and analyzed. To get a deeper and clearer understanding of your company’s performance, contact BYRD.