
The basics of commonly used metrics
KPIs fall into different categories and vary based on the nature of the business (eg. Marketing KPIs vs Financial KPIs). They can become specific to certain activities based on what management wants to understand and see.
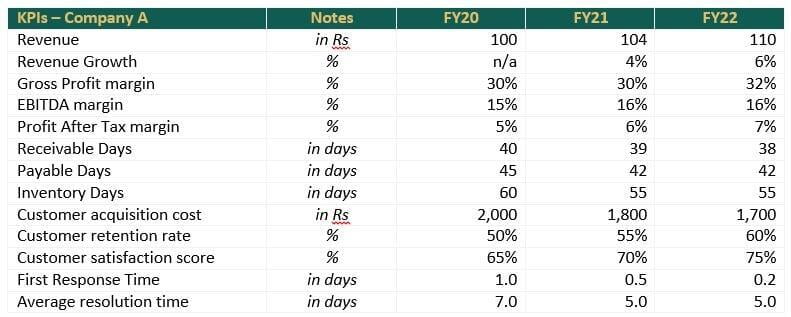
Let’s take the example of Company A and focus on some commonly used KPIs, shown in the table below, to understand their meaning and use.
Types of Key Performance Indicators
1. Financial KPIs
Financial KPIs are metrics derived from a company’s set of accounts. These are based on the financial performances of a business, as shown below:
· Revenue Growth
This metric shows the change in revenue generated by the company year-on-year.
e.g. Company A’s revenue grew from Rs 100 to Rs 104 between Financial Year 2020 (“FY20”) and FY21, representing an increase of 4%.
· Gross Profit margin (“GP margin”)
The GP margin represents the profit made on sales after deducting all associated costs (cost of sales).
e.g. Company A’s GP margin in FY20 is 30.0%, meaning that the associated costs necessary to generate a revenue of Rs 100 were Rs 70.
· Earnings before interest, Tax, Depreciation and Amortization margin (“EBITDA margin”)
The EBITDA is a measure of a company’s earnings before any interest and/or tax payable for the year, as well as any deductions in the Statement of Profit or Loss for Depreciation and/or Amortization on Non-Current assets.
e.g. Company A’s EBITDA margin in FY20 is 15.0%. In other words, the earnings generated by the company after deducting the cost of sales and operating expenses but before interest, tax, depreciation and amortization were Rs 15 for a revenue of Rs 100.
· Profit After Tax margin (“PAT margin”)
The PAT margin or Net profit margin is a measure of how much net income was generated by the company.
e.g. Company A’s PAT margin in FY20 is 5.0%, meaning that the company net income after all expenses is Rs 5 for a revenue of Rs 100.
· Cash Conversion Cycle (“CCC”)
The cash conversion cycle or cash cycle is a metric made up of Receivable days, Payable days and Inventory days, which expresses the time taken by the company to turn its resources into cash. This metric is crucial when analyzing a company’s cash flow situation.
o Receivable days (“AR”)
The average receivable days metric illustrates the time taken by customers to pay their invoices or, in other words, period taken by the company to collect what is owed.
e.g. In FY20, Company A took, on average, 40 days to collect outstanding invoices.
o Payable days (“AP”)
The average payable days metric, on the opposite the AR, shows the duration taken by the company to pay what it owes.
e.g. In FY20, Company A took, on average, 45 days to pay its outstanding invoices.
o Inventory days (“AI”)
The third metric of the CCC is the average inventory days, or the number of days a product stays in storage before being sold by the company.
e.g. Company A took, on average, 60 days to turn a product sitting in the warehouse to a sale.
Based on the above data, the CCC [AR - AP + AI] is 55 days. This metric means that company A took just under 2 months to convert its resources into cash flows.
2. Customer-focused KPIs
Customer-focused KPIs are qualitative metrics derived from a relationships with clients and the quality of service proposed, as shown below:
· Customer acquisition cost (“CAC”)
The CAC metric indicates a business how much it spends to acquire new clients. This KPI combines marketing and financial data.
e.g. Company A spent Rs 2,000 in FY20 to acquire a new customer, meaning that for every Rs 2,000 spent on marketing, the company gains 1 additional client.
· Customer retention rate (“CRR”)
The CRR ratio is simply the percentage of existing clients that remain the company’s clients after X amount of time. This metric helps management understand what keeps their existing customer around and how to improve their customer services.
e.g. In FY20, Company A CRR was 50%. In other words, 1 out of 2 client stayed with the firm for X amount of time.
· Customer satisfaction score (“CSAT”)
The CSAT KPI is a customer service and customer loyalty indicator. It helps business gauge how satisfied customers are with a specific service or overall experience.
e.g. Company A’s CSAT was 65% in FY20. According to the CSAT ratio, nearly 2/3rd of the customers were satisfied with the proposed product/service.
3. Operational KPIs
Operational KPIs are metrics derived from the responsiveness of employees, as shown below:
· First Response Time (“FTR”)
FTR is a metric of responsiveness from the business employees. It displays the average time taken by an employee to provide an initial response to a customer enquiry.
e.g. Average FTR of company A was 1 day in FY20.
· Average resolution time (“ART”)
Resolution time, as it is called, is the average time taken by a company’s employee / agent to solve a specific issue for its customer.
e.g. In FY20, Company A took, on average, 7 days to solve a client’s issue.
The Dos and DON’Ts of KPIs
There are numerous KPIs and metrics that can be used to understand your business performance in depth and better analyze where the bottlenecks are. This data should be easy to understand, communicated throughout the organization and lead to positive changes.
However, it is crucial to determine the metrics relevant to the company, which brings a value added to management. Collecting and trying to analyze too much data may result in creating confusion rather than a clear picture of the company’s performance. Also, ensure that the metrics provide both qualitative, quantitative, financial and non-financial assessments to cover a broader range of carefully selected KPIs.
Do not hesitate to contact BYRD for more information.